Terminal UI Guide
Stormlog ships a Textual TUI for teams that want to move between live monitoring, exported artifacts, and command execution without leaving the terminal.
Install and launch
pip install "stormlog[tui,torch]"
stormlog
Running stormlog with no arguments still launches the TUI. The explicit
stormlog tui form is also available when you want to distinguish the TUI from
other top-level command groups such as stormlog infer.
If you are working from a source checkout, reinstall with the TUI dependencies so the current app startup requirements are present:
pip install -e ".[tui,torch]"
Current tabs
The current TUI surface contains seven tabs:
OverviewPyTorchTensorFlowMonitoringVisualizationsDiagnosticsCLI & Actions
What each tab is for
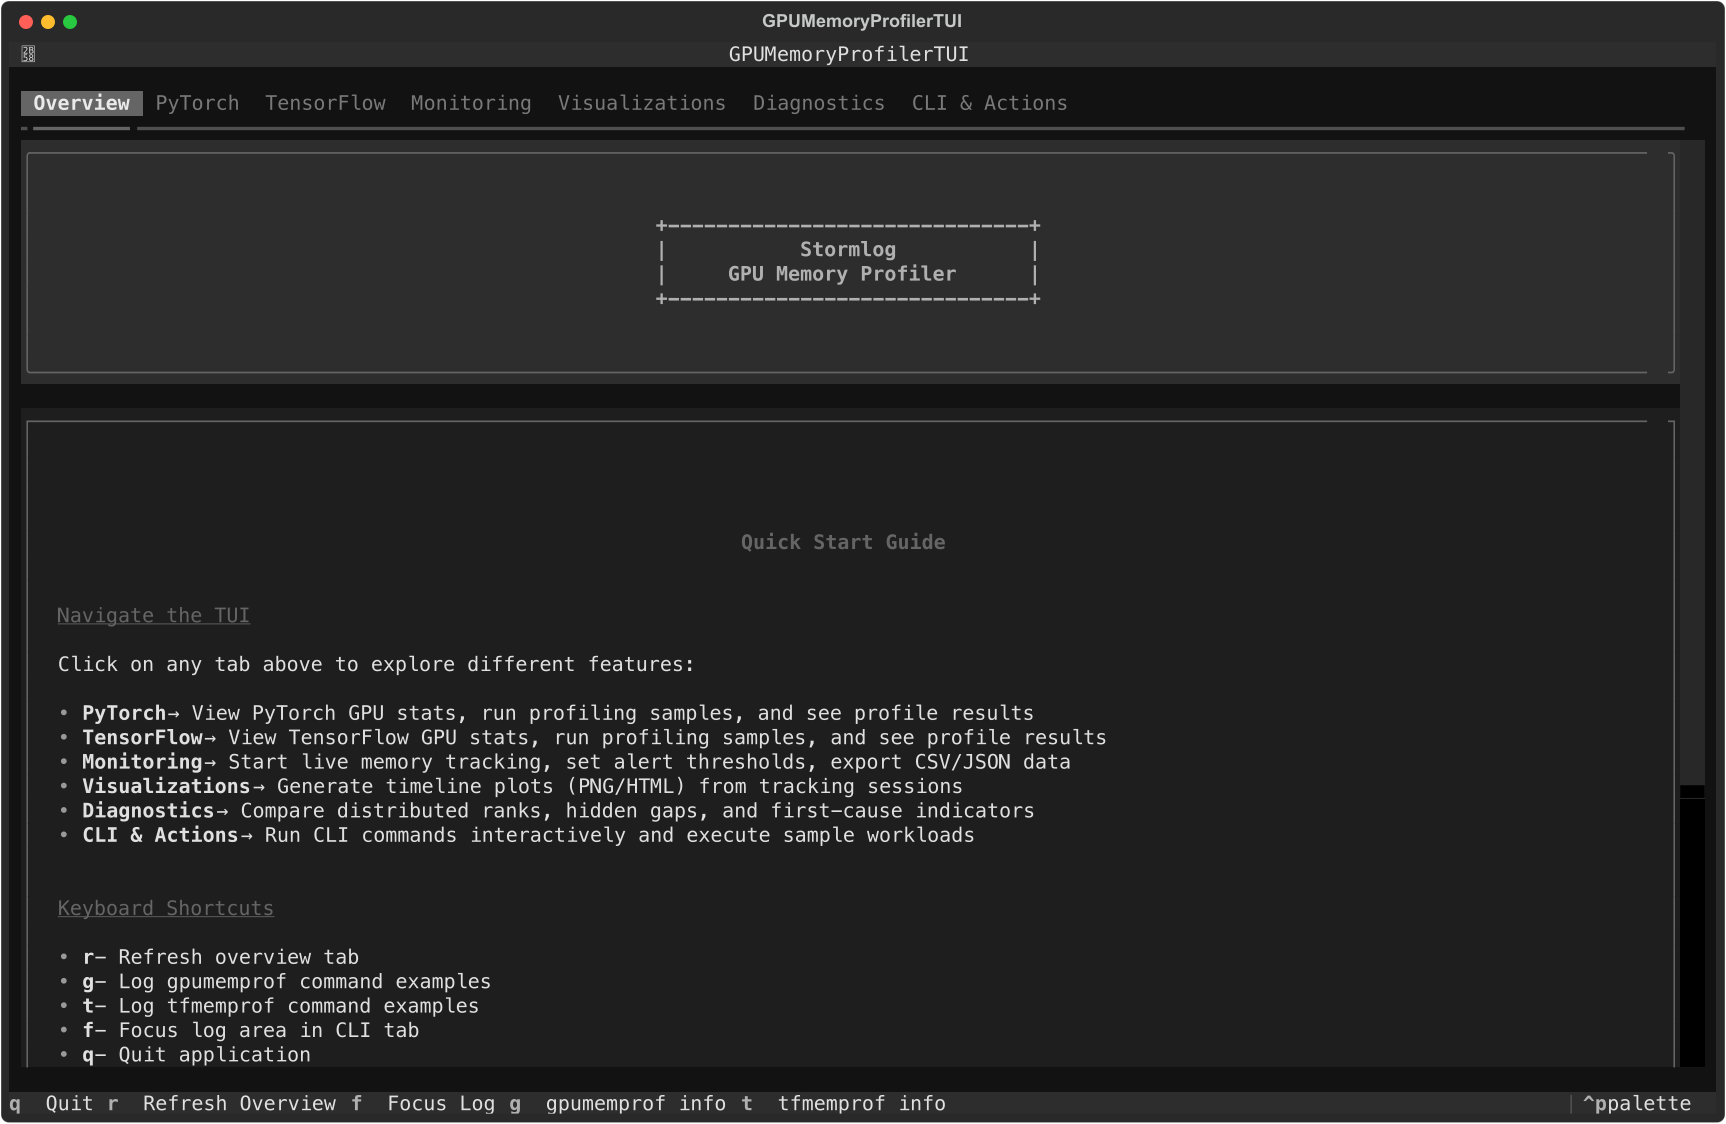
Overview
shows current platform and runtime information
links you to the recommended sample commands
is the fastest place to confirm that the app launched with the expected environment
PyTorch
shows current PyTorch stats
runs a sample PyTorch workload
refreshes or clears collected profile summaries
If CUDA is unavailable, the sample workload falls back to the CPU profiler path when possible.
TensorFlow
shows TensorFlow environment details
runs a sample TensorFlow workload
refreshes or clears collected TensorFlow profile summaries
Monitoring
starts or stops a live tracker session
shows rolling memory stats
exports current tracker events to
./exportslets you tune warning and critical thresholds when using the GPU tracker
exposes watchdog controls for supported GPU environments
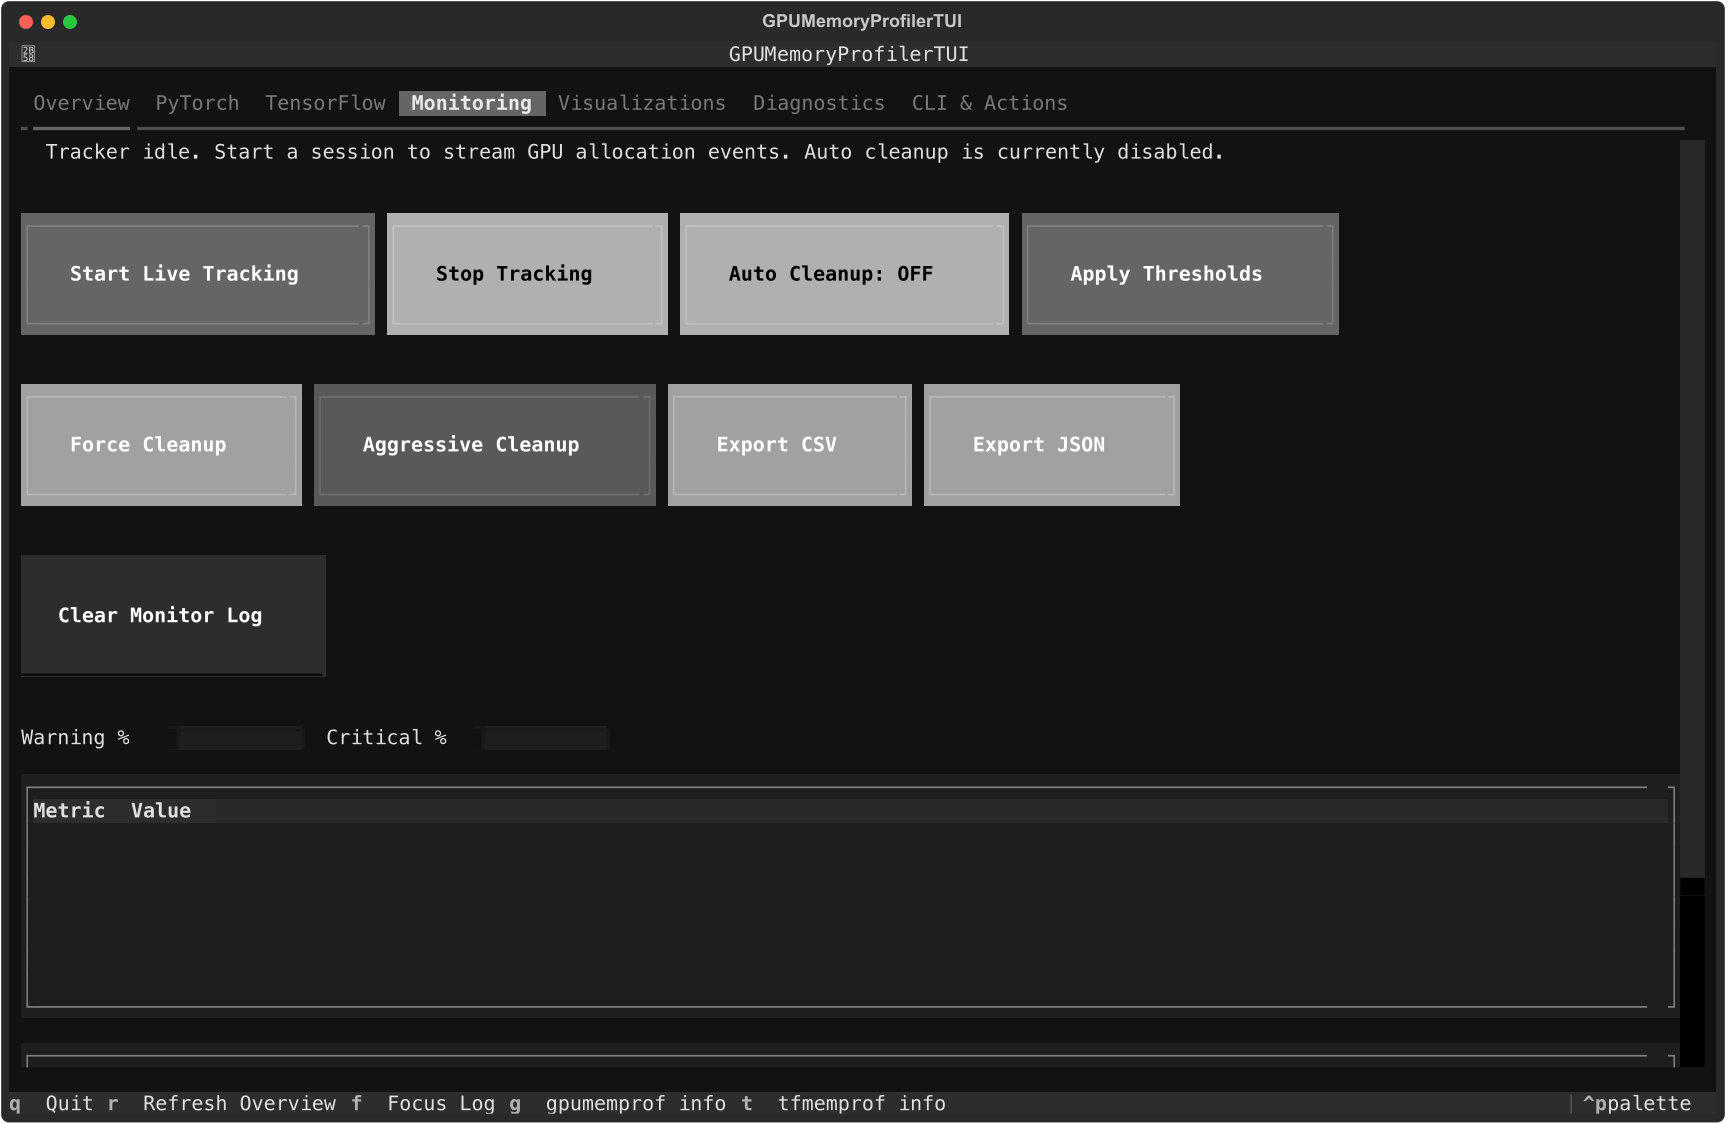
Use this tab when you want the data that later feeds the Visualizations or Diagnostics tabs.
Visualizations
renders an ASCII timeline from the active tracker session
writes PNG plots to
./visualizationswrites HTML plots to
./visualizations
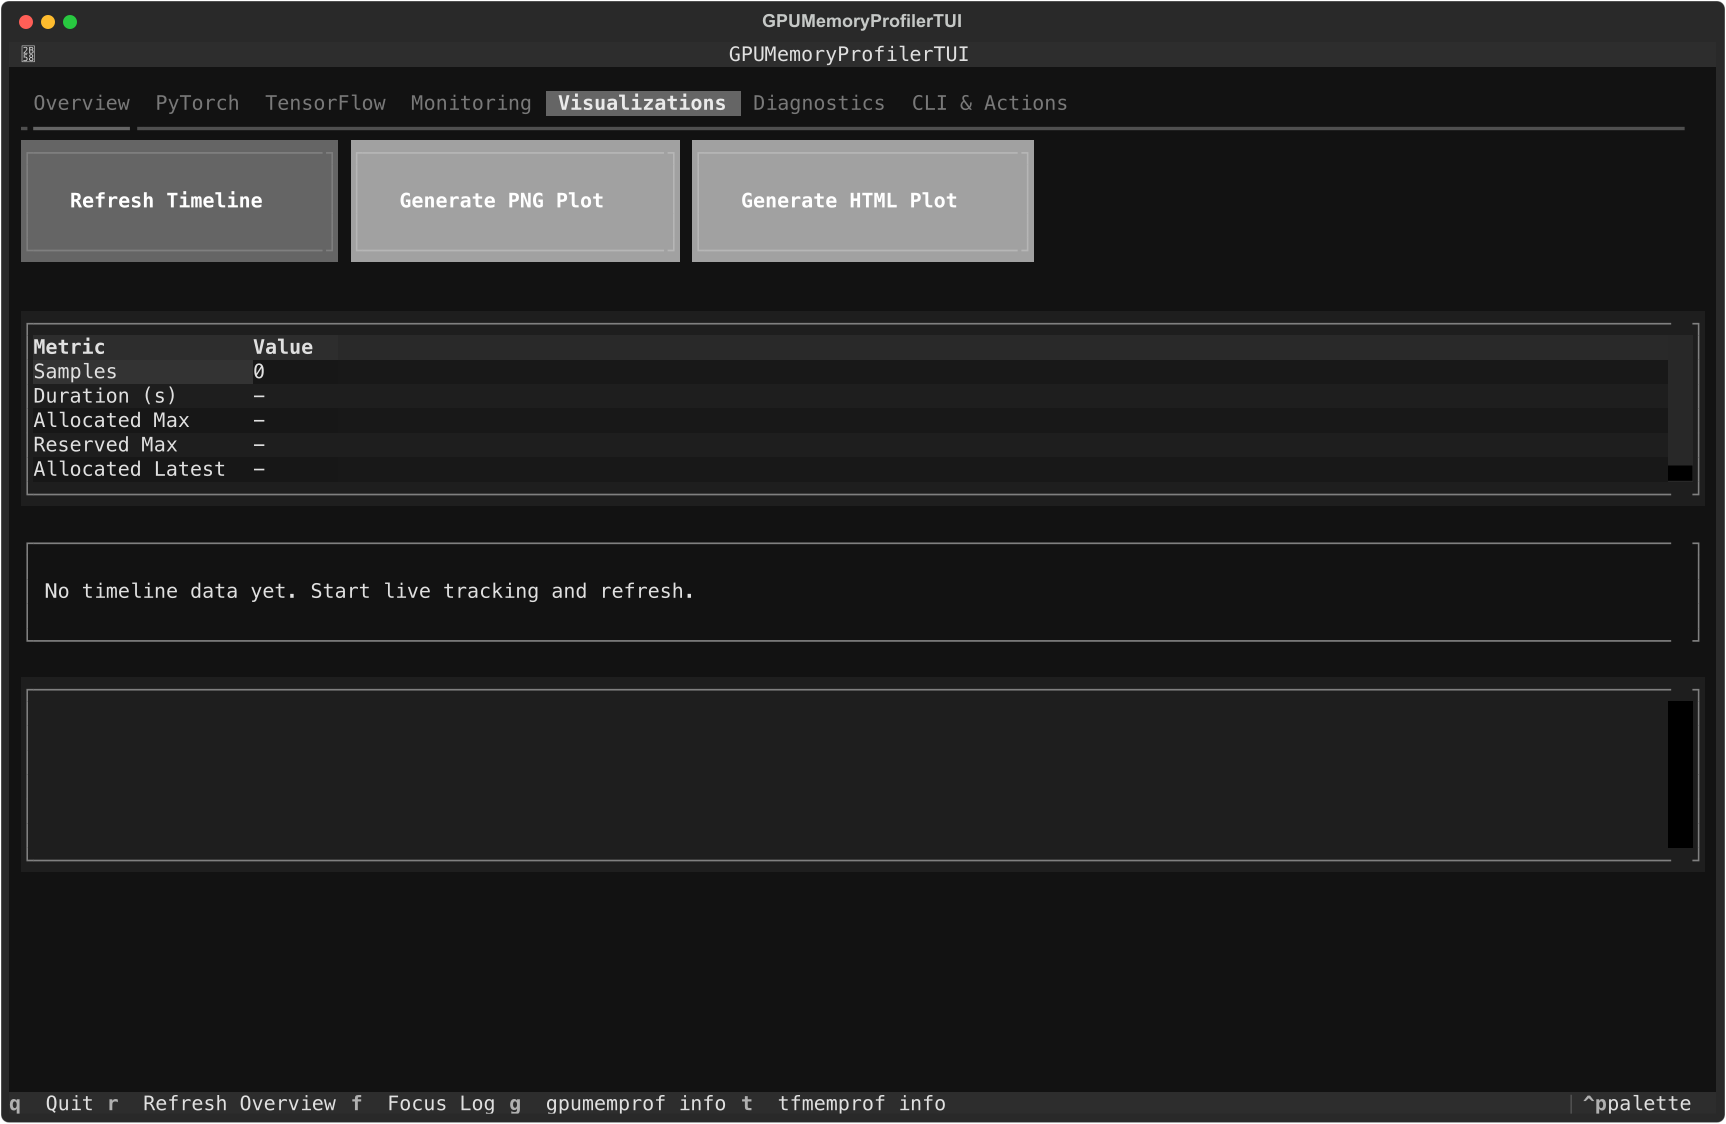
The export buttons only work after timeline samples exist. If you have not started tracking yet, the tab will report that no timeline data is available.
Diagnostics
loads live telemetry from the active tracker session
loads artifacts from JSON, CSV, or diagnose directories
discovers and lists distinct artifact sessions instead of merging them silently
lets you target a specific session id after loading artifacts
rebuilds rank-level diagnostics
supports rank filters such as
all,0,2,4-7highlights anomaly indicators and focused rank timelines
surfaces phase paths for first anomalies and earliest indicators when phase telemetry is present
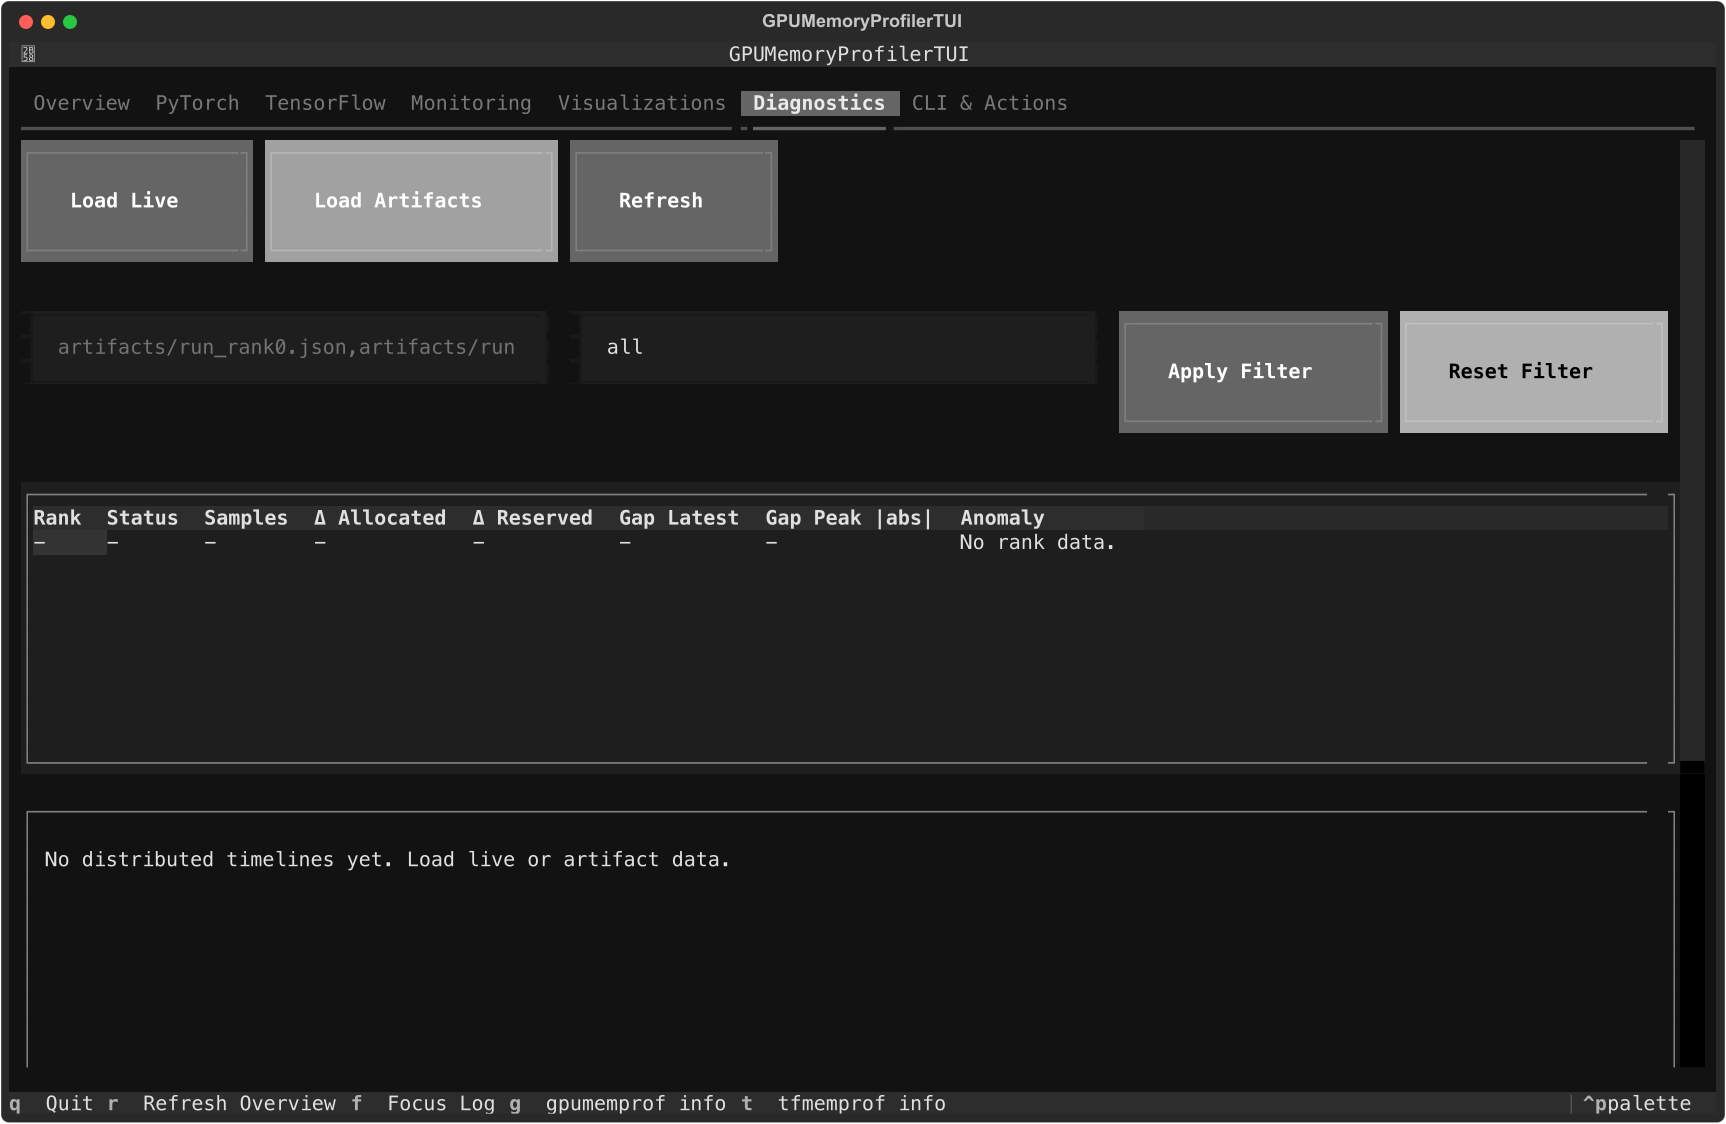
The artifact input field accepts comma-separated paths. Use Load Artifacts
first, then Refresh after changing the path set. When multiple sessions are
found, the Diagnostics tab defaults to the newest completed session and lets
you switch to another one by entering its session id.
If the loaded telemetry contains phase_enter / phase_exit records, rank rows
and earliest-indicator details show the resolved phase path directly in the
Diagnostics model.
When the product is choosing a useful winner from an otherwise ambiguous phase
set, the TUI surfaces that with a (likely) marker instead of flattening it
into an exact attribution.
That marker is presentation-only. The underlying diagnostics model still keeps the canonical phase attribution separate from any heuristic winner.
CLI & Actions
runs common
gpumemprofandtfmemprofcommandsruns sample workloads
runs the OOM scenario helper
runs the capability matrix smoke path
lets you enter any shell command into the inline runner
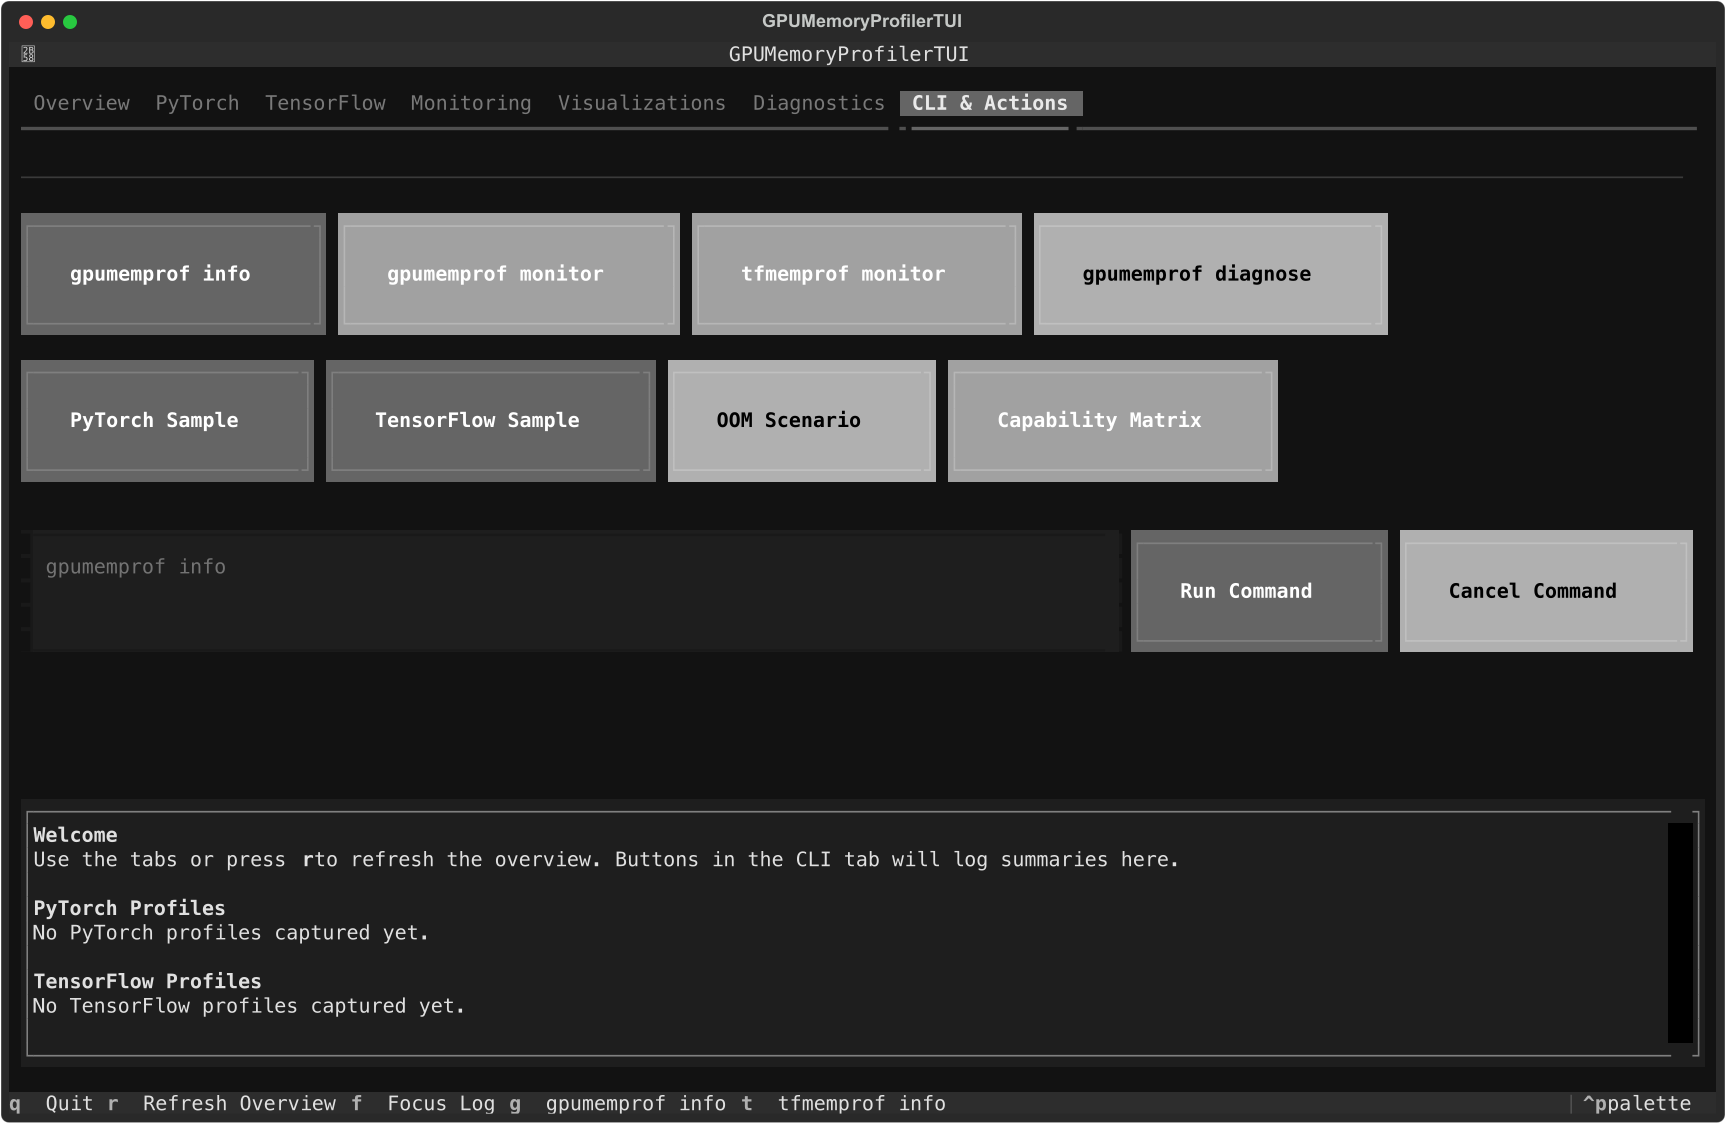
Use this tab when you want to kick off a CLI flow and keep the output attached to the same TUI session.
Daily workflows
Workflow: capture and export a live session
Open
Monitoring.Click
Start Live Tracking.Let the workload run long enough to collect samples.
Use
Export CSVorExport JSONif you want the raw event stream.Move to
Visualizationsand clickRefresh Timeline.Export PNG or HTML if you want a shareable plot.
Workflow: investigate a saved artifact
Open
Diagnostics.Enter one or more artifact paths.
Click
Load Artifacts.If multiple sessions were discovered, optionally enter a session id and apply it.
Click
Refresh.Narrow the result set with the rank filter if needed.
Select a rank from the table to focus the timeline.
Workflow: run the release smoke path from the UI
Open
CLI & Actions.Click
Capability Matrix.Review the inline log output.
If you need more detail, rerun the same command in a normal shell and archive the artifacts.
The screenshot above reflects the shipped Diagnostics tab. Older distributed diagnostics mockups have been removed from the docs because they no longer match the current product surface.
For incident playbooks and rank-aware operational workflows that start in the TUI Diagnostics tab, use Distributed Diagnostics Recipes and Incident Playbooks.
Keyboard shortcuts
Key |
Action |
|---|---|
|
Refresh overview |
|
Focus the CLI log |
|
Log |
|
Log |
|
Quit the TUI |
Troubleshooting
stormlog is missing
Install the TUI extra:
pip install "stormlog[tui,torch]"
Capability Matrix or OOM Scenario fails with ModuleNotFoundError
Those quick actions run source-only examples.* modules. If you installed from
PyPI, use the inline command runner with the equivalent CLI-safe flow instead:
gpumemprof info
gpumemprof track --duration 10 --interval 0.5 --output track.json --format json
gpumemprof diagnose --duration 0 --output ./diag
For full button coverage, use a source checkout with:
pip install -e ".[tui,torch]"
PNG or HTML export fails
install
stormlog[viz]make sure you already have live timeline samples
Diagnostics shows no data
load live telemetry after starting a tracker session, or
load actual JSON, CSV, or diagnose artifact paths before refreshing
The app launched but the window looks empty
Increase the terminal size. The deterministic tests use roughly 140x44, and smaller sizes will compress the layout significantly.