PyTorch Production Recipes
Use these recipes when the workload is owned by PyTorch and you need a fast path from a memory incident to a saved artifact and an actionable next step.
Audience: ML engineers, incident responders. Difficulty: intermediate.
Prerequisites
install the package first with Installation
use
pip install "stormlog[torch]"for the PyTorch CLI and tracker pathson a fresh GPU host, check the framework build before using GPU recipes:
python -c "import torch; print(torch.__version__, torch.version.cuda, torch.cuda.is_available())"use
pip install "stormlog[tui,torch]"if you want the TUI diagnostics flowuse a PyTorch runtime when you need
GPUMemoryProfileror CUDA-specific OOM evidenceuse the Usage Guide if you need API-level reference instead of CLI-first triage
Success signal:
the first workload-backed recipe records non-zero GPU memory
you leave the incident with at least one saved artifact or report
the chosen workflow ends in a concrete next step, not just console output
Choose the first PyTorch recipe
If the main goal is… |
Start with… |
|---|---|
check a small in-process workload first |
profile a single GPU step |
capture a short, shareable timeline |
bounded |
save a portable diagnostic bundle fast |
|
capture CUDA allocator-history evidence |
|
rehearse the OOM flow safely in a checkout |
|
Recipe: profile a single GPU step
import torch
from stormlog import GPUMemoryProfiler

profiler = GPUMemoryProfiler(track_tensors=True)
device = profiler.device
model = torch.nn.Linear(1024, 256).to(device)

def train_step() -> torch.Tensor:
    x = torch.randn(64, 1024, device=device)
    y = model(x)
    return y.sum()

profile = profiler.profile_function(train_step)
summary = profiler.get_summary()

print(profile.function_name)
print(f"Peak memory: {summary['peak_memory_usage'] / (1024**2):.2f} MB")
Use this when you want a small in-process CUDA workload before moving to CLI artifact flows.
If torch.cuda.is_available() is False on a GPU host, fix the PyTorch build
before continuing. The Installation Guide and
GPU Setup Guide are the right references there.
Recipe: validate a real L4 training run and pull back the artifacts
This recipe was validated from a source checkout against a JarvisLabs L4
container using examples.scenarios.wandb_training_smoke in wandb offline
mode.
Use it when you need one short real training run that proves:
CUDA training is actually happening
Stormlog writes a bounded sink and summary bundle during training
the downloaded artifacts can be inspected with both
gpumemprof analyzeand the TUI Diagnostics tabstructured
phase_enter/phase_exittelemetry is present in a real workload-backed capture
1. Resume the paused L4 instance and record the new machine id
jl resume <paused-machine-id> --yes --json
Resume can return a new machine_id. Use the new id for the rest of the flow.
2. Verify CUDA on the resumed host
Use the Jarvis SSH key that is registered with your account:
ssh -i ~/.ssh/<jarvis-key> -o StrictHostKeyChecking=no root@<public-ip> \
  'python3 - <<'"'"'PY'"'"'
import torch
print("torch", torch.__version__)
print("cuda_available", torch.cuda.is_available())
print("device_name", torch.cuda.get_device_name(0) if torch.cuda.is_available() else None)
PY'
Success signal:
cuda_available Truethe expected GPU name prints, for example
NVIDIA L4
3. Sync the current checkout to the instance
rsync -az --delete \
  --exclude '.git' \
  --exclude '.venv*' \
  --exclude '.mypy_cache' \
  --exclude '.pytest_cache' \
  --exclude '.ruff_cache' \
  --exclude '.coverage' \
  --exclude '__pycache__' \
  --exclude 'artifacts' \
  --exclude 'wandb' \
  --exclude 'docs/_build' \
  -e 'ssh -i ~/.ssh/<jarvis-key> -o StrictHostKeyChecking=no' \
  ./ root@<public-ip>:/home/gpu-memory-profiler/
This keeps the remote run pinned to the exact local branch state, including any uncommitted scenario or docs changes you are qualifying.
4. Create a small project venv on the instance
ssh -i ~/.ssh/<jarvis-key> -o StrictHostKeyChecking=no root@<public-ip> \
  'cd /home/gpu-memory-profiler && \
   python3 -m venv --system-site-packages .venv && \
   .venv/bin/pip install -U pip && \
   .venv/bin/pip install -e ".[wandb,tui]"'
The --system-site-packages flag reuses the template’s CUDA-backed PyTorch
install instead of replacing it.
5. Launch the bounded CUDA training run
ssh -i ~/.ssh/<jarvis-key> -o StrictHostKeyChecking=no root@<public-ip> \
  'cd /home/gpu-memory-profiler && \
   mkdir -p artifacts/jarvis_wandb_training_smoke && \
   .venv/bin/python -m examples.scenarios.wandb_training_smoke \
     --device cuda \
     --epochs 2 \
     --batch-size 128 \
     --train-samples 4096 \
     --val-samples 1024 \
     --num-workers 2 \
     --interval 0.1 \
     --output-dir artifacts/jarvis_wandb_training_smoke \
     --wandb-project stormlog-smoke \
     --wandb-name jarvis-wandb-training-smoke \
     --wandb-mode offline \
     --wandb-log-artifacts \
     2>&1 | tee artifacts/jarvis_wandb_training_smoke/run.log'
Success signal:
the logs print
Device: cudaepoch metrics advance, for example:
Epoch 1/2 ...Epoch 2/2 ...the final lines print both:
Summary: .../training_summary.jsonTelemetry sink: .../telemetry_sink
6. Confirm the remote artifact set
ssh -i ~/.ssh/<jarvis-key> -o StrictHostKeyChecking=no root@<public-ip> \
  'cd /home/gpu-memory-profiler && \
   find artifacts/jarvis_wandb_training_smoke -maxdepth 2 -type f | sort'
Expected files:
artifacts/jarvis_wandb_training_smoke/run.logartifacts/jarvis_wandb_training_smoke/training_summary.jsonartifacts/jarvis_wandb_training_smoke/stormlog_tracking_dashboard.htmlartifacts/jarvis_wandb_training_smoke/telemetry_sink/manifest.jsonartifacts/jarvis_wandb_training_smoke/telemetry_sink/segment-000001.jsonl
If you want to confirm that structured phase telemetry was recorded in this real training run:
ssh -i ~/.ssh/<jarvis-key> -o StrictHostKeyChecking=no root@<public-ip> \
  'cd /home/gpu-memory-profiler && python3 - <<'"'"'PY'"'"'
from pathlib import Path
import json
root = Path("artifacts/jarvis_wandb_training_smoke/telemetry_sink")
count = 0
for path in sorted(root.rglob("*.jsonl")):
    for line in path.read_text(encoding="utf-8").splitlines():
        payload = json.loads(line)
        event_type = payload.get("event_type") or payload.get("type")
        if str(event_type).startswith("phase_"):
            count += 1
print("phase_records", count)
PY'
The validated L4 run produced hundreds of phase boundary records.
7. Pull the run back to your workstation and analyze it locally
rsync -az \
  -e 'ssh -i ~/.ssh/<jarvis-key> -o StrictHostKeyChecking=no' \
  root@<public-ip>:/home/gpu-memory-profiler/artifacts/jarvis_wandb_training_smoke/ \
  ~/Desktop/jarvis_wandb_training_smoke/

gpumemprof analyze \
  ~/Desktop/jarvis_wandb_training_smoke/telemetry_sink \
  --format txt \
  --output ~/Desktop/jarvis_wandb_training_smoke/analysis.txt
Success signal:
analyzeselects a completed session from the sinkanalysis.txtis written beside the downloaded artifacts
8. Load the same sink in the TUI Diagnostics tab
Start the TUI from the same source checkout.
Open
Diagnostics.Enter
~/Desktop/jarvis_wandb_training_smoke/telemetry_sink.Click
Load Artifacts.Click
Refresh.If more than one session appears, keep the newest
completedsession.
This is the same artifact set the CLI analyzed. Do not point the TUI at a different directory if you want a faithful reproduction of the run.
Recipe: capture a bounded CLI artifact window
gpumemprof track \
  --duration 30 \
  --interval 0.5 \
  --output ./track.json \
  --format json
Use this when you want a short capture that you can archive, share, or analyze without keeping a sink directory around.
Treat this as an artifact-flow command after the runtime is already known-good. On an otherwise idle CLI process it can record little or no meaningful GPU activity by itself.
Recipe: export a diagnose bundle
gpumemprof diagnose --duration 0 --output ./diag_bundle
Use --duration 0 when you want the bundle structure and current runtime
context quickly, not a new long sampling window.
Recipe: capture CUDA-native OOM evidence
gpumemprof diagnose --native-history --duration 0 --output ./diag_bundle_native
This is the CUDA-only path for allocator-history artifacts such as native snapshots and state-history files.
Do not use this path on CPU-only or non-CUDA hosts. Fall back to the standard diagnose bundle there.
Recipe: generate the annotated allocator-history HTML
python -m examples.basic.cuda_native_history_demo --output ./diag_bundle_native_demo
This is source-checkout only. Use it when you want a workload-backed artifact that reliably populates the Stormlog-native annotated HTML instead of capturing an otherwise idle CLI process.
The command writes the standard native-history files plus
cuda_allocator_state_history_annotated.html, which combines the timeline
trace, segment explorer, and active-memory table in one self-contained file.
What the annotated HTML shows
Generated from examples.basic.cuda_native_history_demo on an L4 host:
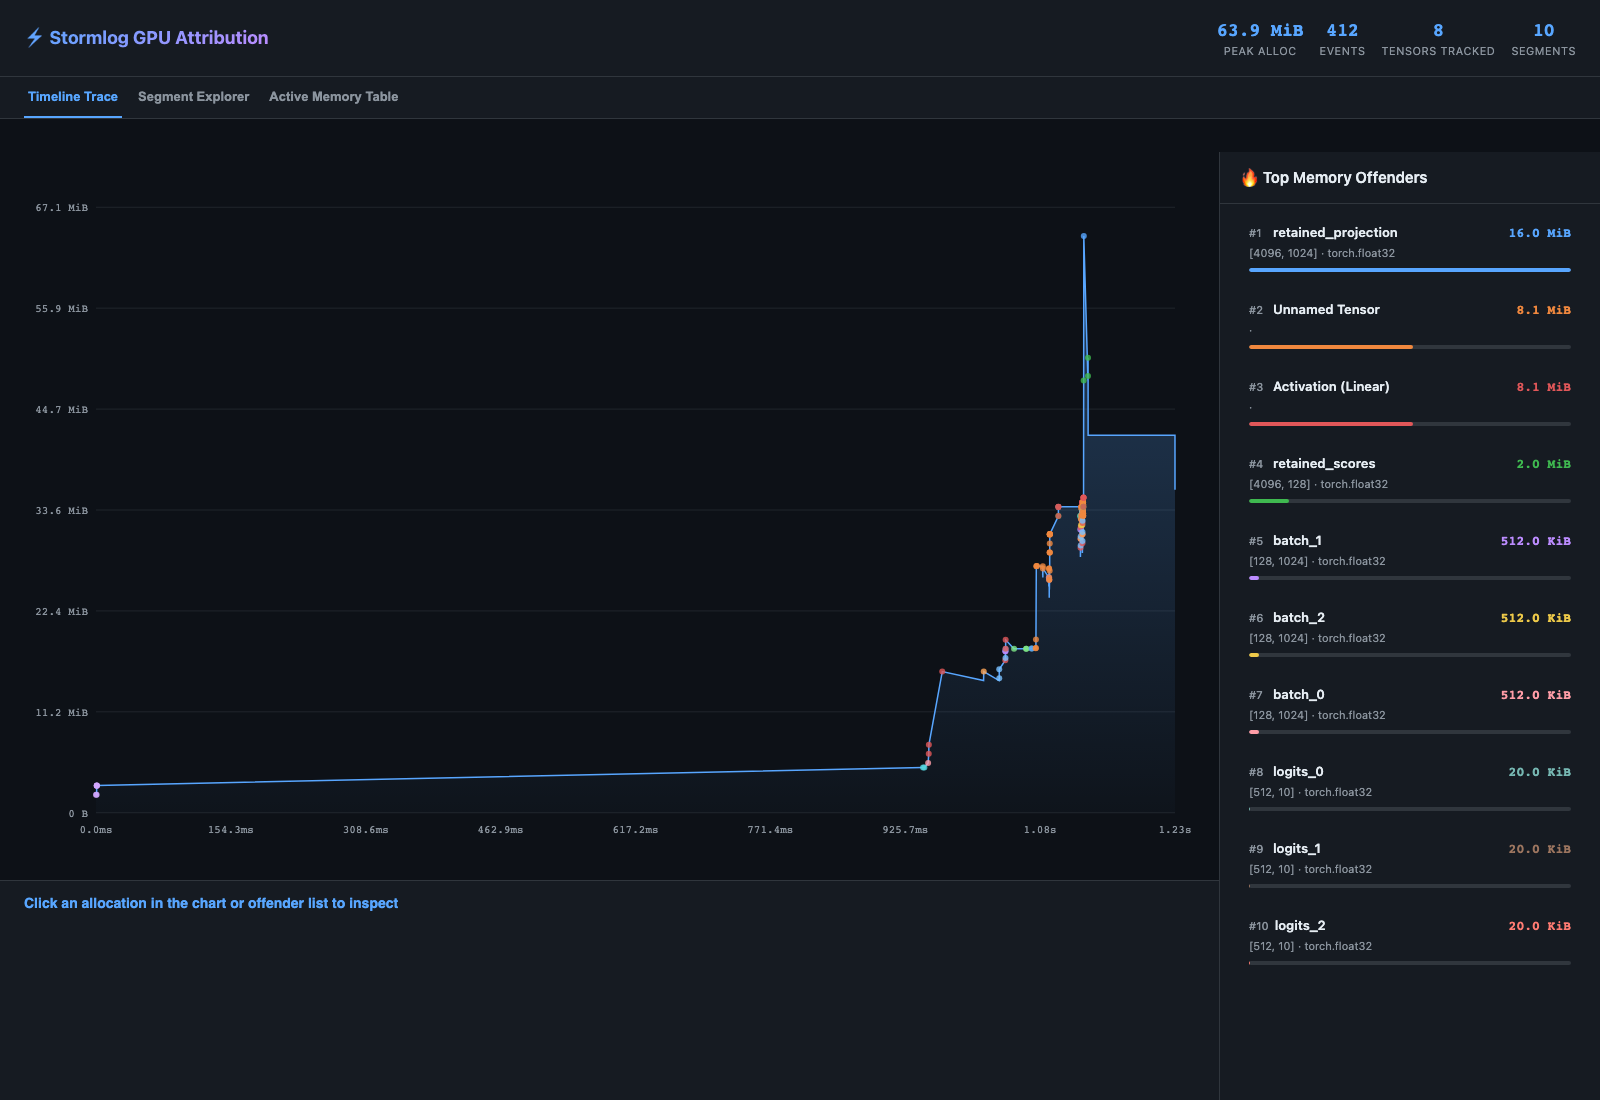
The timeline trace lets you inspect cumulative allocator growth and click into a specific attributed allocation.
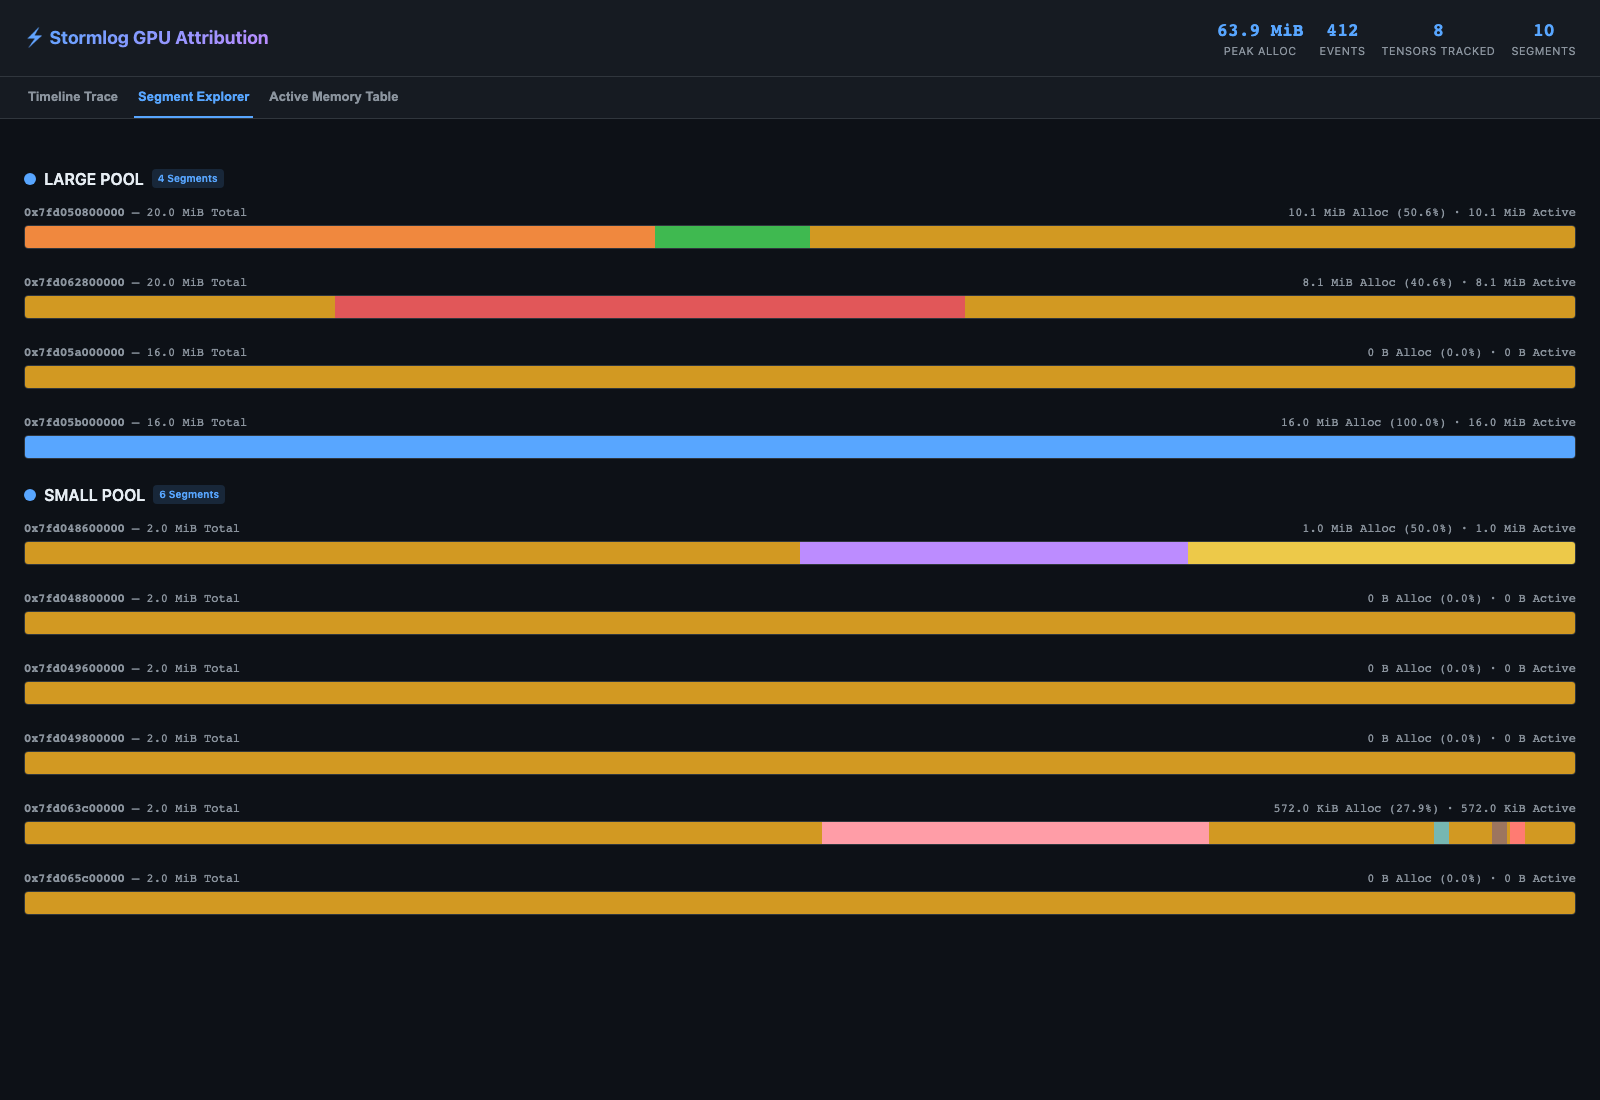
The segment explorer shows how each CUDA segment is partitioned between active allocations and inactive/fragmented blocks.
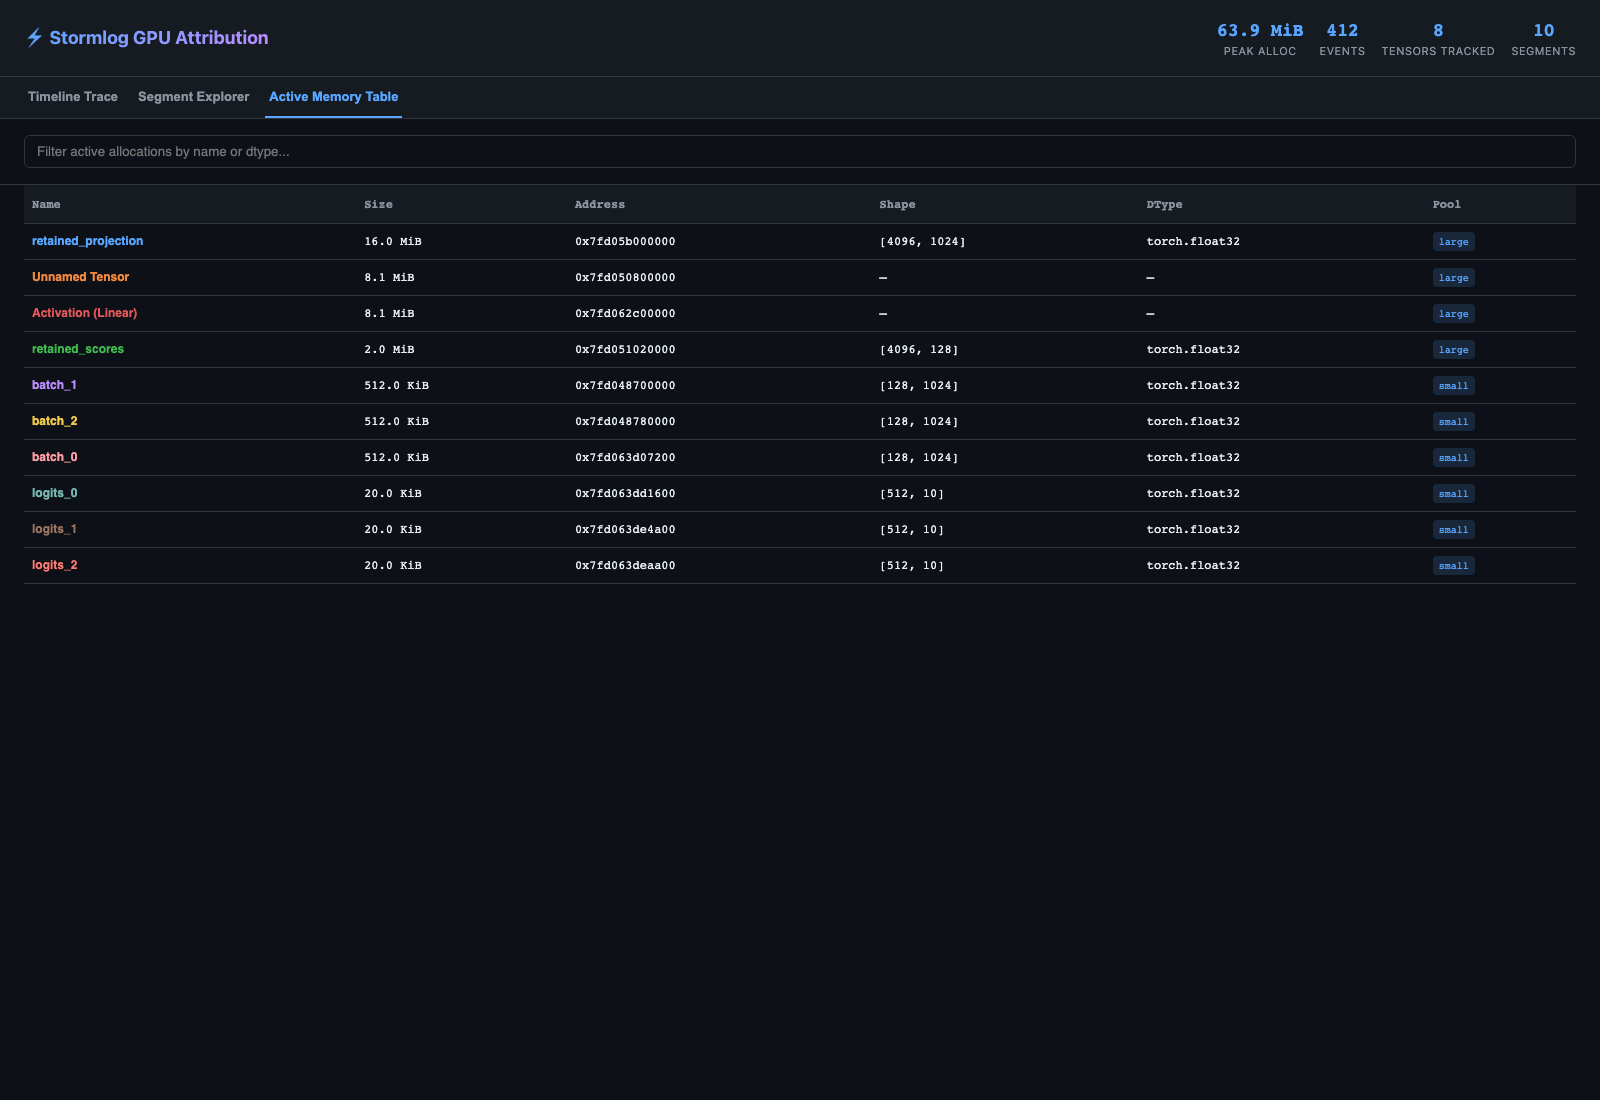
The active-memory table is the fastest way to confirm which named tensors or retained activations were still live at snapshot time.
Recipe: turn saved telemetry into a report
gpumemprof analyze ./track.json --format txt --output ./analysis.txt
Use --visualization --plot-dir ./plots when you also want saved plots.
Recipe: rehearse the OOM workflow safely from a source checkout
python -m examples.scenarios.oom_flight_recorder_scenario --mode simulated
This is source-checkout only. Pip installs do not include examples/.
What to look for in the report
critical_issueshigh_impact_insightsrecommendationsoptimization_scoregap_analysiswhen telemetry events are availablecollective_attributionwhen hidden-memory spikes align with communication signals
What to do next
If
critical_issuesor high-priority recommendations point to growth over time, move to the Incident Playbooks leak and growth path.If
gap_analysisis populated, move to the hidden-memory-gap checklist in Incident Playbooks.If
collective_attributionis populated and the workload is multi-rank, move to the Distributed Diagnostics Recipes.If the main need is a long-running operational deployment, move to Always-on Tracking.
Troubleshooting
Symptom: diagnose --native-history fails immediately
Likely cause: the runtime is not CUDA-backed. Fix: use the standard diagnose bundle instead. Verify: the regular diagnose command completes and writes a manifest.
Symptom: torch.cuda.is_available() is False on a GPU host
Likely cause: the installed PyTorch wheel does not match the host driver/runtime.
Fix: install a PyTorch build that matches the current CUDA stack, then rerun the
minimal GPUMemoryProfiler snippet above.
Verify: the version check in prerequisites prints True for
torch.cuda.is_available().